> ## Documentation Index
> Fetch the complete documentation index at: https://docs.assetinfinity.ai/llms.txt
> Use this file to discover all available pages before exploring further.
# Finding your way around
> The sidebar, the header, global search, the command palette, the site switcher, notifications and the sync tray.
Every screen sits inside the same shell: navigation down the left, tools across the top.
 ## The sidebar
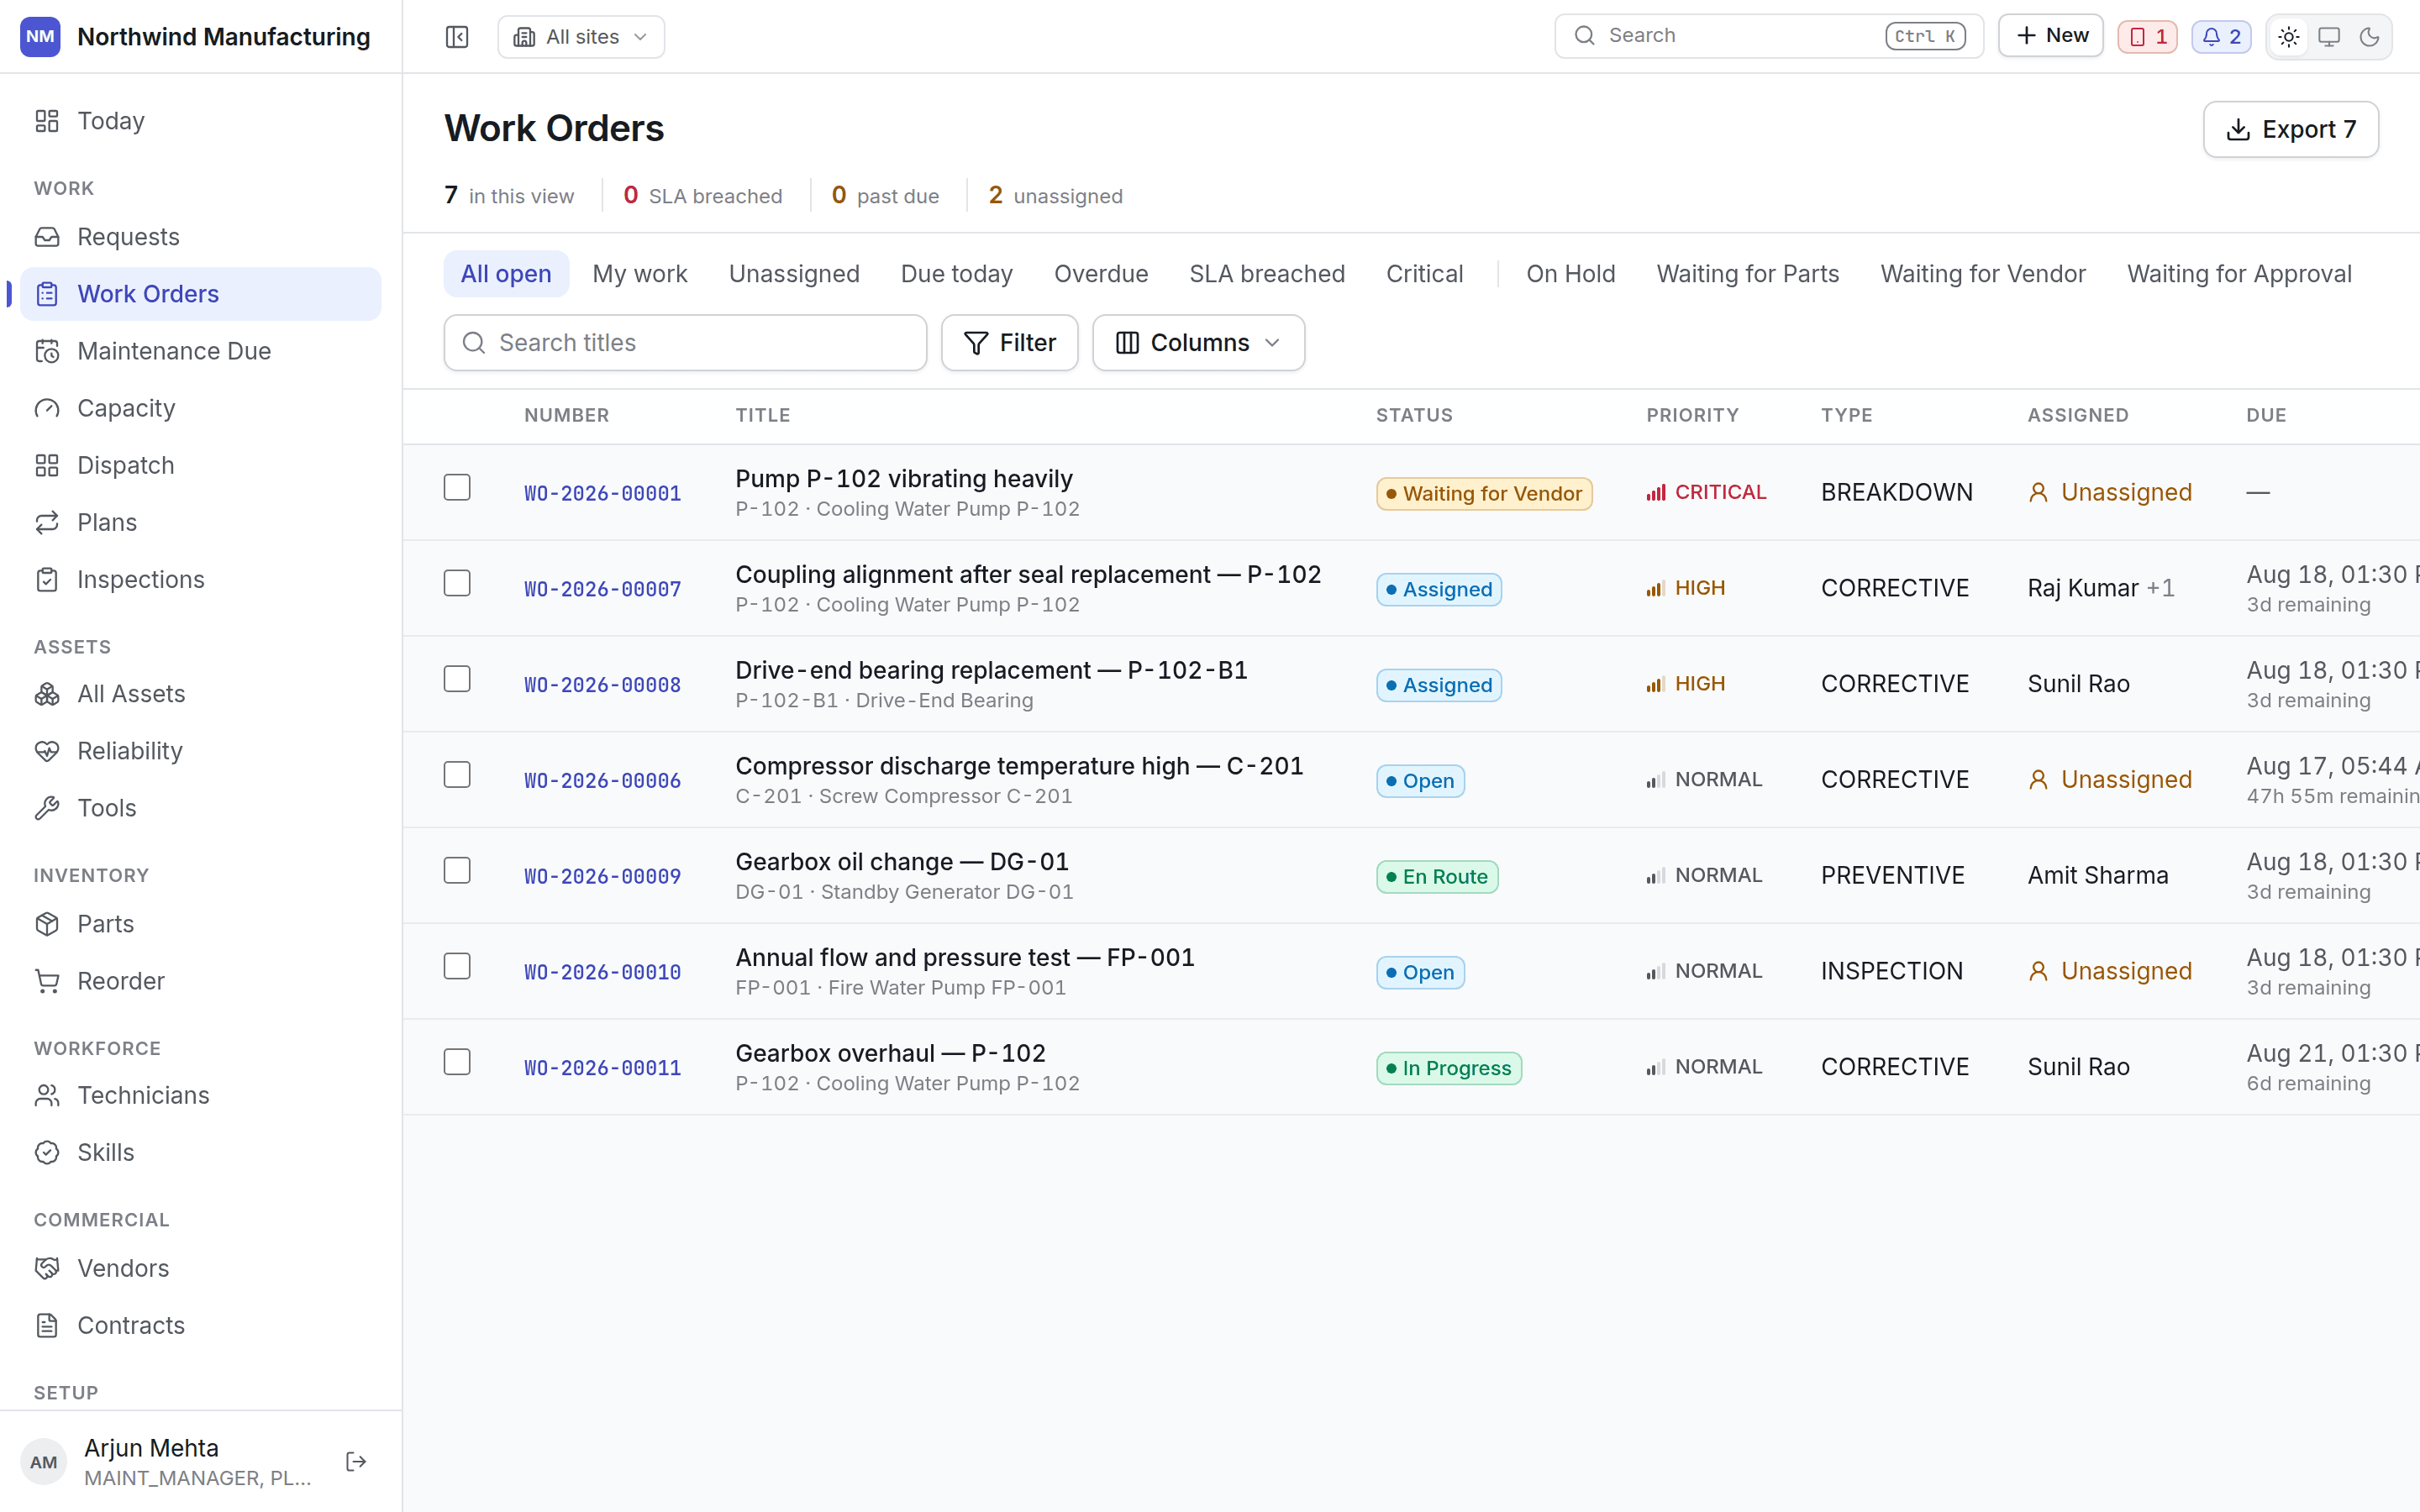
Screens are grouped by what you are doing, not by which table they read.
| Group | Screens |
| -------------- | ------------------------------------------------------------------------------------ |
| **Today** | Your dashboard |
| **Work** | Requests · Work Orders · Maintenance Due · Capacity · Dispatch · Plans · Inspections |
| **Assets** | All Assets · Reliability · Root Cause · Sensors · Tools |
| **Inventory** | Parts · Reorder |
| **Workforce** | Technicians · Skills |
| **Commercial** | Vendors · Contracts |
| **Analytics** | Reports · Copilot |
| **Setup** | Administration |
Root Cause sits directly under Reliability because that is where an investigation starts — a
recommendation saying *this has failed seven times* is what opens one. Sensors sits with the
machines because a sensor is an attribute of an asset, not a monitoring department.
You only see what your roles permit. A technician's sidebar is much shorter than an
administrator's — this is not a fault, it is [access control](/setup/access) working.
Three layouts, one set of links:
* **Full sidebar** — the default on a desktop.
* **Icon rail** — click the panel button beside the organisation name to collapse it and get the
width back. Your choice is remembered.
* **Drawer** — on narrower screens the sidebar becomes a slide-over you open with the menu button,
because a permanent sidebar would eat half a tablet.
## The sidebar
Screens are grouped by what you are doing, not by which table they read.
| Group | Screens |
| -------------- | ------------------------------------------------------------------------------------ |
| **Today** | Your dashboard |
| **Work** | Requests · Work Orders · Maintenance Due · Capacity · Dispatch · Plans · Inspections |
| **Assets** | All Assets · Reliability · Root Cause · Sensors · Tools |
| **Inventory** | Parts · Reorder |
| **Workforce** | Technicians · Skills |
| **Commercial** | Vendors · Contracts |
| **Analytics** | Reports · Copilot |
| **Setup** | Administration |
Root Cause sits directly under Reliability because that is where an investigation starts — a
recommendation saying *this has failed seven times* is what opens one. Sensors sits with the
machines because a sensor is an attribute of an asset, not a monitoring department.
You only see what your roles permit. A technician's sidebar is much shorter than an
administrator's — this is not a fault, it is [access control](/setup/access) working.
Three layouts, one set of links:
* **Full sidebar** — the default on a desktop.
* **Icon rail** — click the panel button beside the organisation name to collapse it and get the
width back. Your choice is remembered.
* **Drawer** — on narrower screens the sidebar becomes a slide-over you open with the menu button,
because a permanent sidebar would eat half a tablet.
 ## The header
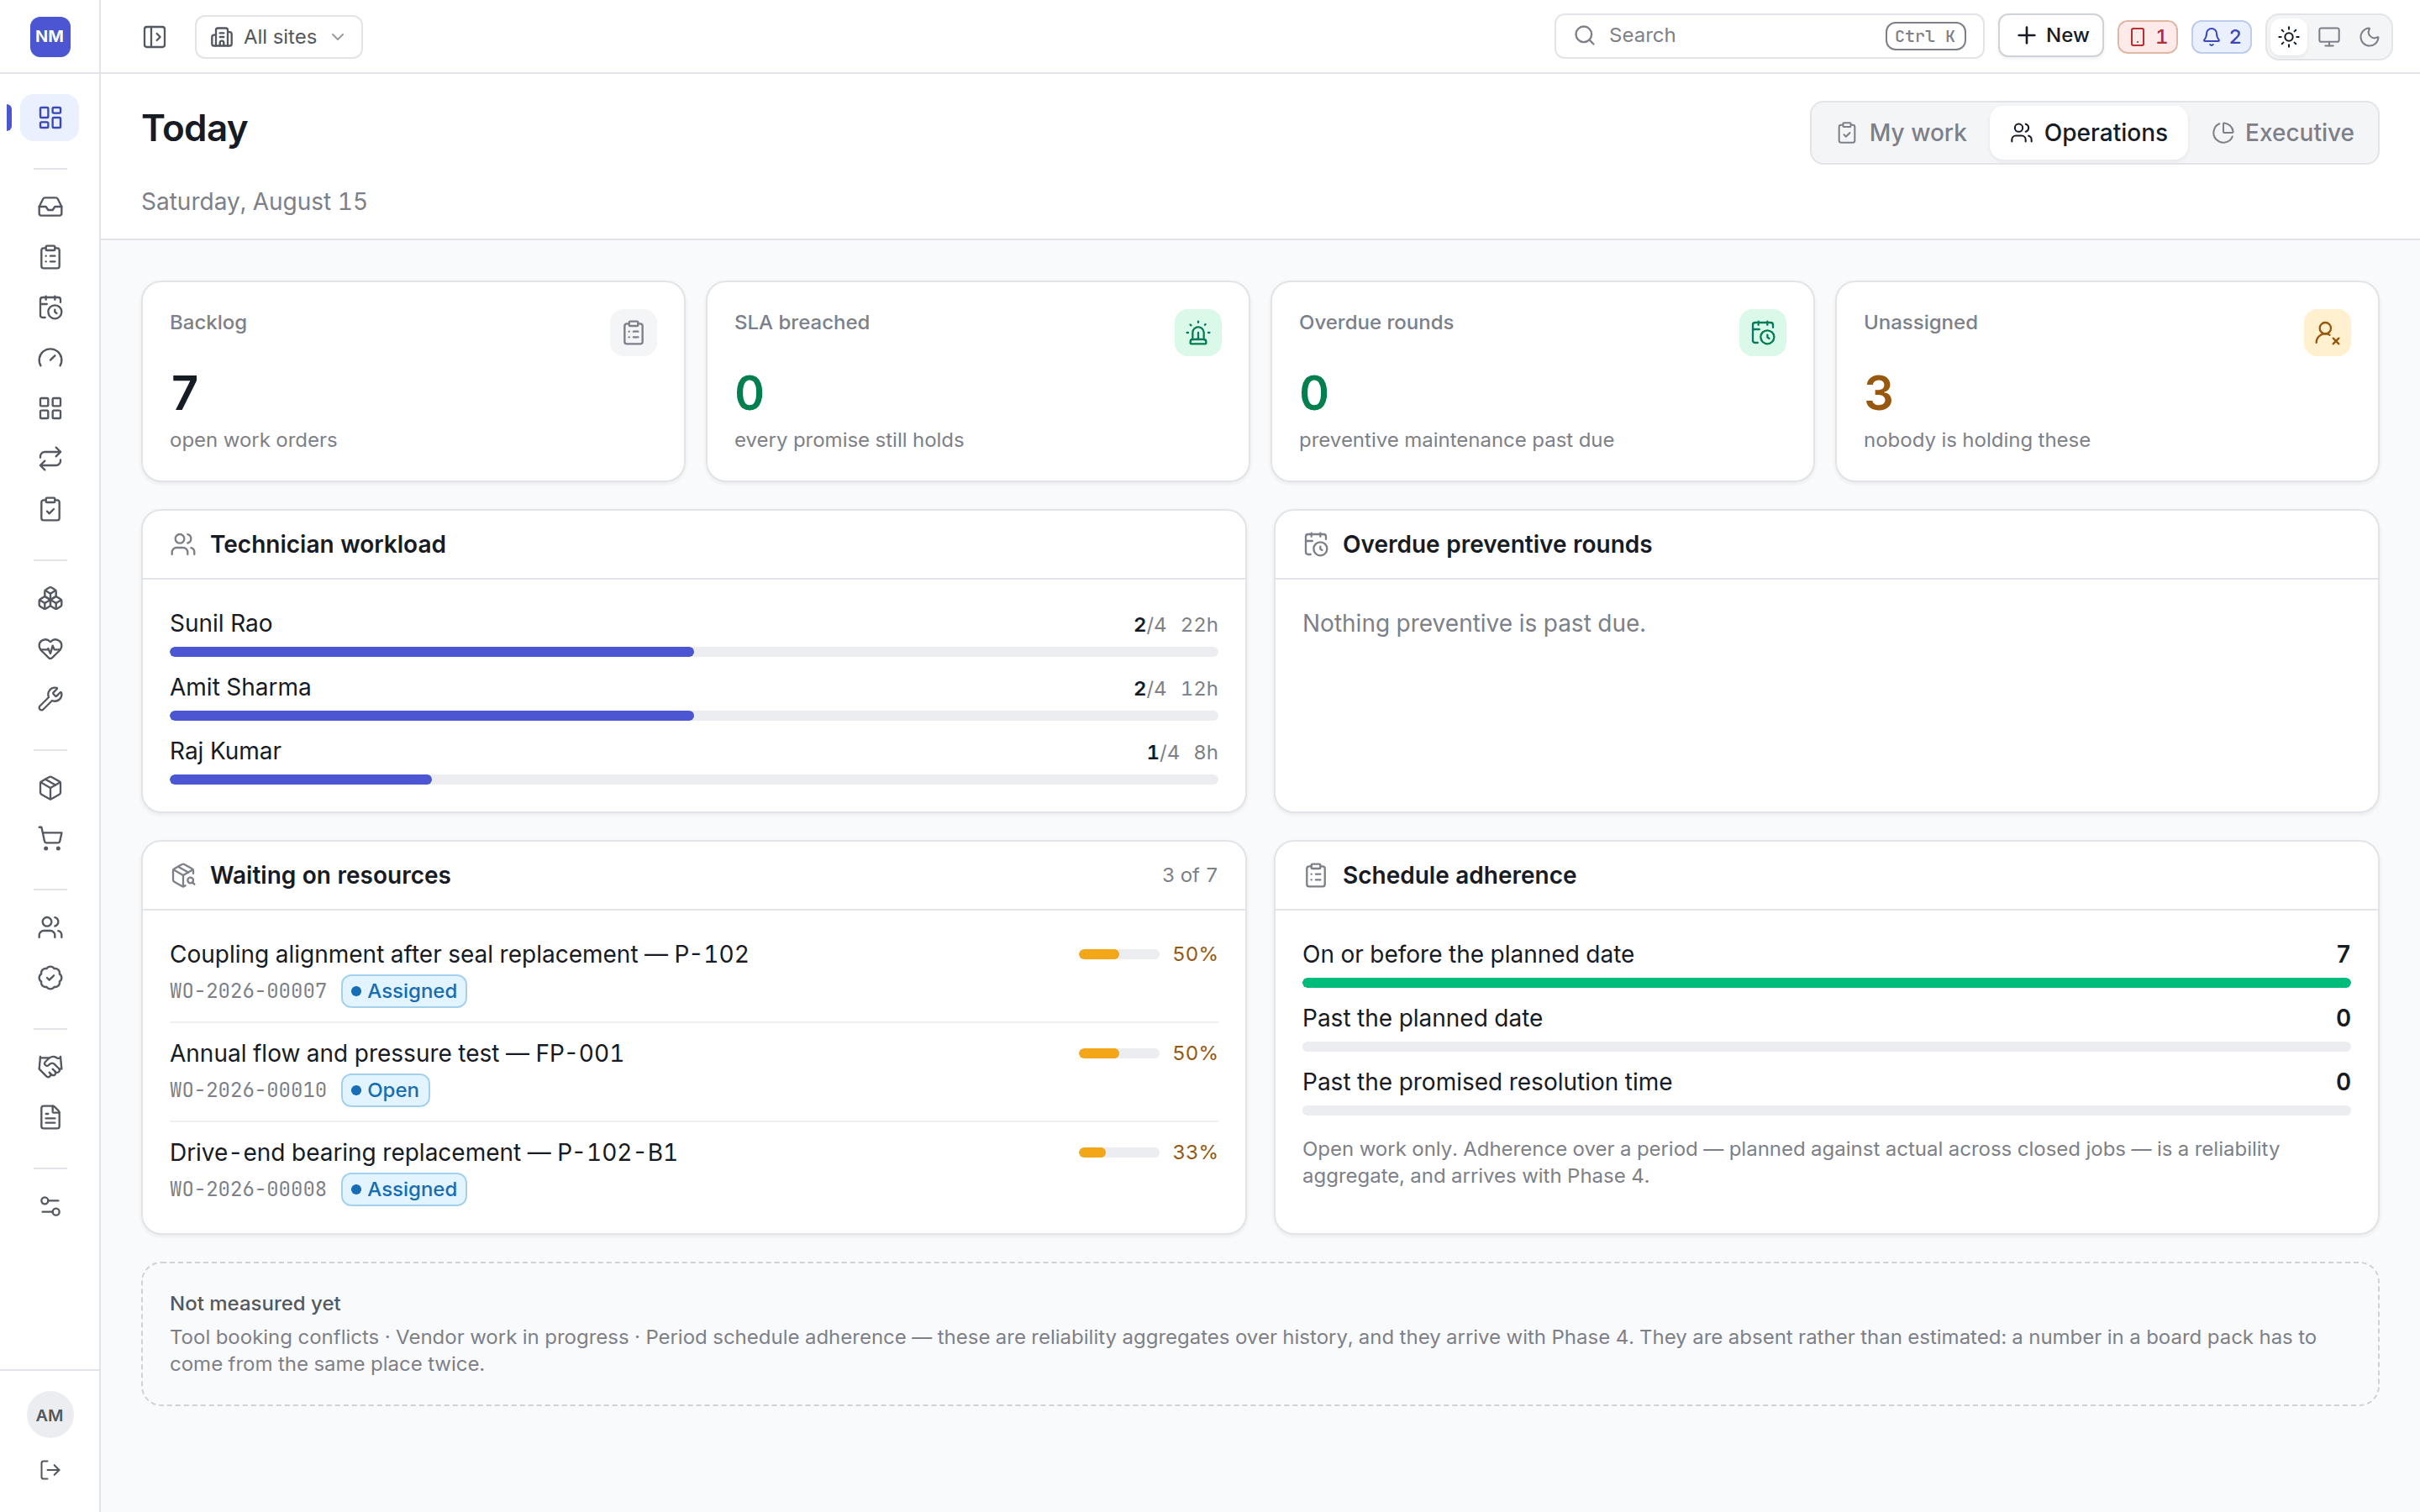
Narrows every screen to one site. Choose **All sites** to widen again. A banner appears while a
filter is active so a half-empty list is never a mystery.
This is a view filter, not a permission — it cannot show you a site your account may not reach.
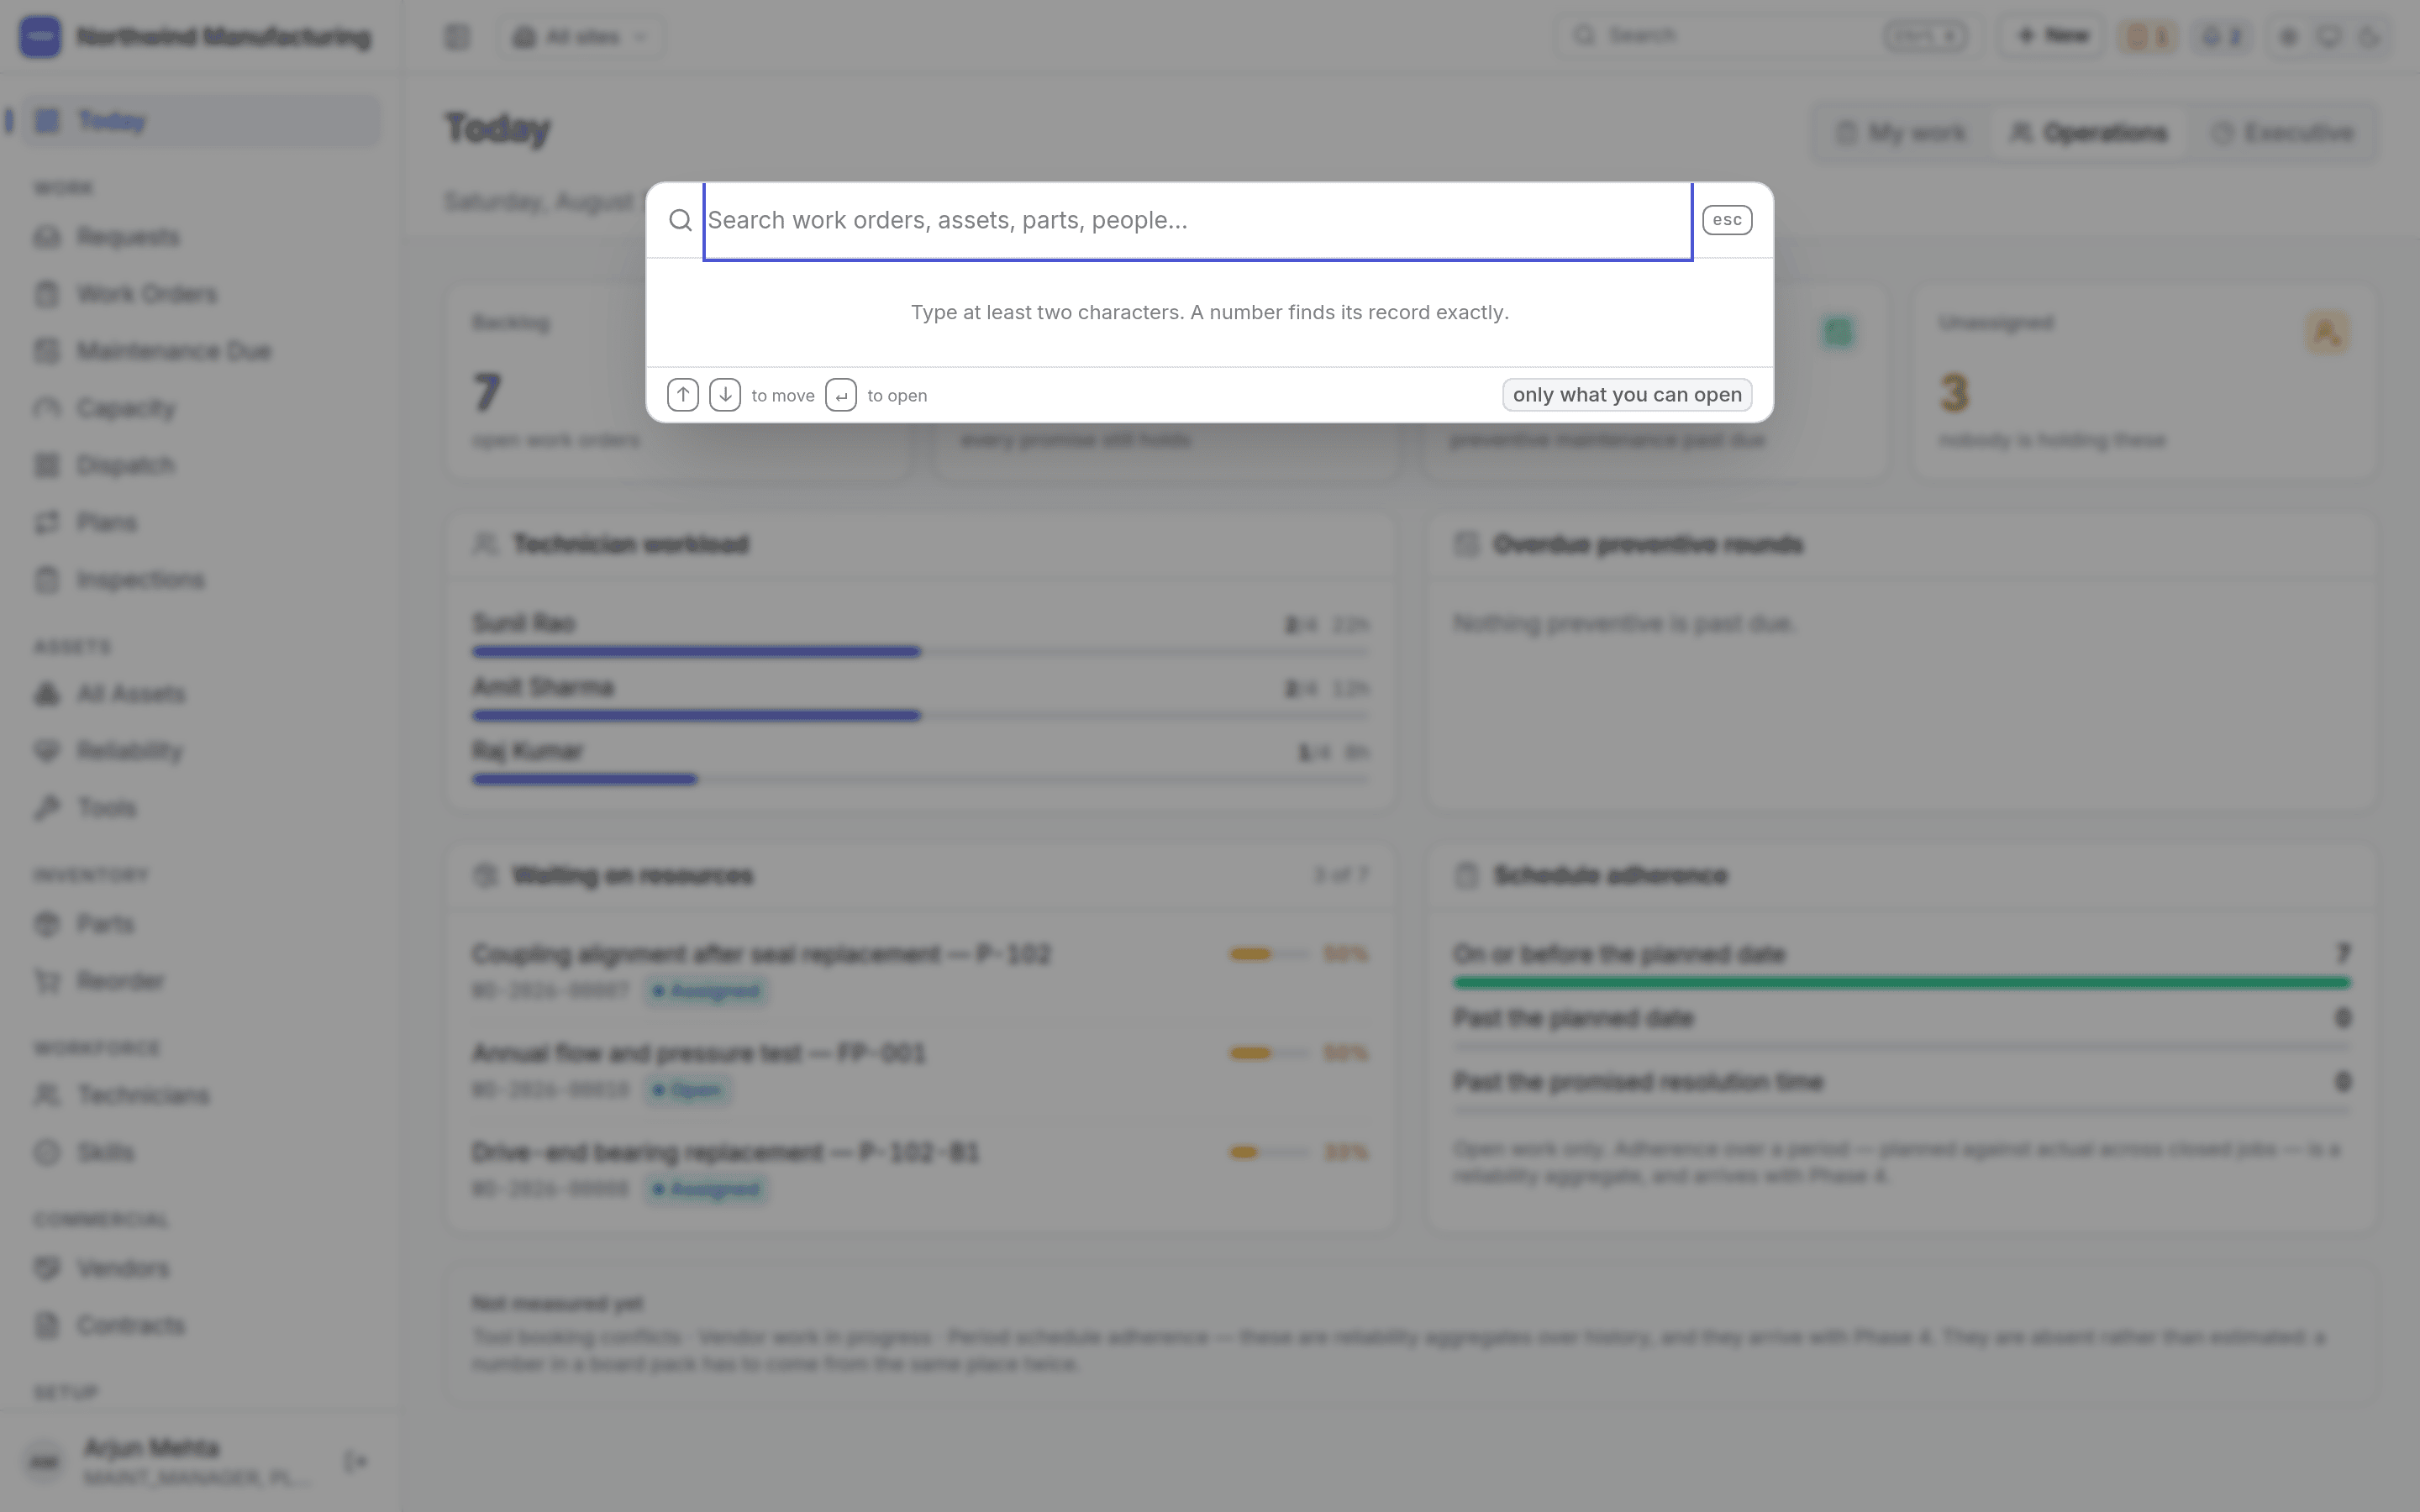
Finds anything you could open: assets, work orders, requests, parts, technicians, vendors,
contracts. Results carry the record type, its number, its status and where it is, so you can
tell two similarly named pumps apart before clicking.
Ctrl+K, or ⌘+K on a Mac. Jump to any screen or record
by typing. Faster than the sidebar once you know where you are going.
## The header
Narrows every screen to one site. Choose **All sites** to widen again. A banner appears while a
filter is active so a half-empty list is never a mystery.
This is a view filter, not a permission — it cannot show you a site your account may not reach.
Finds anything you could open: assets, work orders, requests, parts, technicians, vendors,
contracts. Results carry the record type, its number, its status and where it is, so you can
tell two similarly named pumps apart before clicking.
Ctrl+K, or ⌘+K on a Mac. Jump to any screen or record
by typing. Faster than the sidebar once you know where you are going.
 Creates a record from wherever you are — a work request, work order, asset, maintenance plan,
part, vendor or inspection — without navigating to its screen first.
The bell carries a count of what you have not read: a service level at risk or breached, a
contract or certification expiring, a tool due for calibration, a comment on something you are
on. Reading one takes the count down.
What you are subscribed to is [configurable](/config/notifications).
Beside the bell, and only interesting when it is not. It shows whether anything from the
handsets is stuck — a collision waiting on a decision, or an operation that failed. Nobody opens
a navigation item to find out whether something is broken, so it lives in the header.
Opens the [Sync Center](/field/sync-center).
Light, system or dark. Your choice, stored in your browser.
## Lists
Every list screen works the same way.
* **Views** along the top — the fixed ones plus a chip for each of your organisation's own statuses
and types. A plant that added a fourth on-hold state gets a fourth chip.
* **Search** filters by title or number.
* **Filter** narrows by any column.
* **Columns** chooses what is shown, and what the list is holding back. Your layout is remembered per
list.
* **Order** is yours too: drag a column heading sideways to move it, or drag it up and down in the
Columns menu, which is how you reach a column that is off the right-hand edge. The grip in that
menu also takes the arrow keys, so the arrangement can be made without a mouse. **Back to the
screen's own columns** undoes the lot.
* **Export** downloads what is currently in view, honouring the filters — not the whole table.
## Detail screens
A record opens on its own screen with tabs across the top. The tab strip carries counts, so you can
see there are four open failures without opening the tab.
Actions live in a bar at the top and come from your organisation's own state model. If you expected
a button and it is not there, your configuration does not allow that move from the state the record
is in — see [statuses and transitions](/config/statuses).
## Related topics
- [Your first hour](/quickstart.md)
- [What this system does](/introduction.md)
- [Ways to sign in](/setup/sign-in-methods.md)
- [Root cause and corrective actions](/assets/root-cause.md)
- [Sensors and condition alerts](/assets/sensors.md)
Creates a record from wherever you are — a work request, work order, asset, maintenance plan,
part, vendor or inspection — without navigating to its screen first.
The bell carries a count of what you have not read: a service level at risk or breached, a
contract or certification expiring, a tool due for calibration, a comment on something you are
on. Reading one takes the count down.
What you are subscribed to is [configurable](/config/notifications).
Beside the bell, and only interesting when it is not. It shows whether anything from the
handsets is stuck — a collision waiting on a decision, or an operation that failed. Nobody opens
a navigation item to find out whether something is broken, so it lives in the header.
Opens the [Sync Center](/field/sync-center).
Light, system or dark. Your choice, stored in your browser.
## Lists
Every list screen works the same way.
* **Views** along the top — the fixed ones plus a chip for each of your organisation's own statuses
and types. A plant that added a fourth on-hold state gets a fourth chip.
* **Search** filters by title or number.
* **Filter** narrows by any column.
* **Columns** chooses what is shown, and what the list is holding back. Your layout is remembered per
list.
* **Order** is yours too: drag a column heading sideways to move it, or drag it up and down in the
Columns menu, which is how you reach a column that is off the right-hand edge. The grip in that
menu also takes the arrow keys, so the arrangement can be made without a mouse. **Back to the
screen's own columns** undoes the lot.
* **Export** downloads what is currently in view, honouring the filters — not the whole table.
## Detail screens
A record opens on its own screen with tabs across the top. The tab strip carries counts, so you can
see there are four open failures without opening the tab.
Actions live in a bar at the top and come from your organisation's own state model. If you expected
a button and it is not there, your configuration does not allow that move from the state the record
is in — see [statuses and transitions](/config/statuses).
## Related topics
- [Your first hour](/quickstart.md)
- [What this system does](/introduction.md)
- [Ways to sign in](/setup/sign-in-methods.md)
- [Root cause and corrective actions](/assets/root-cause.md)
- [Sensors and condition alerts](/assets/sensors.md)