

Tabs
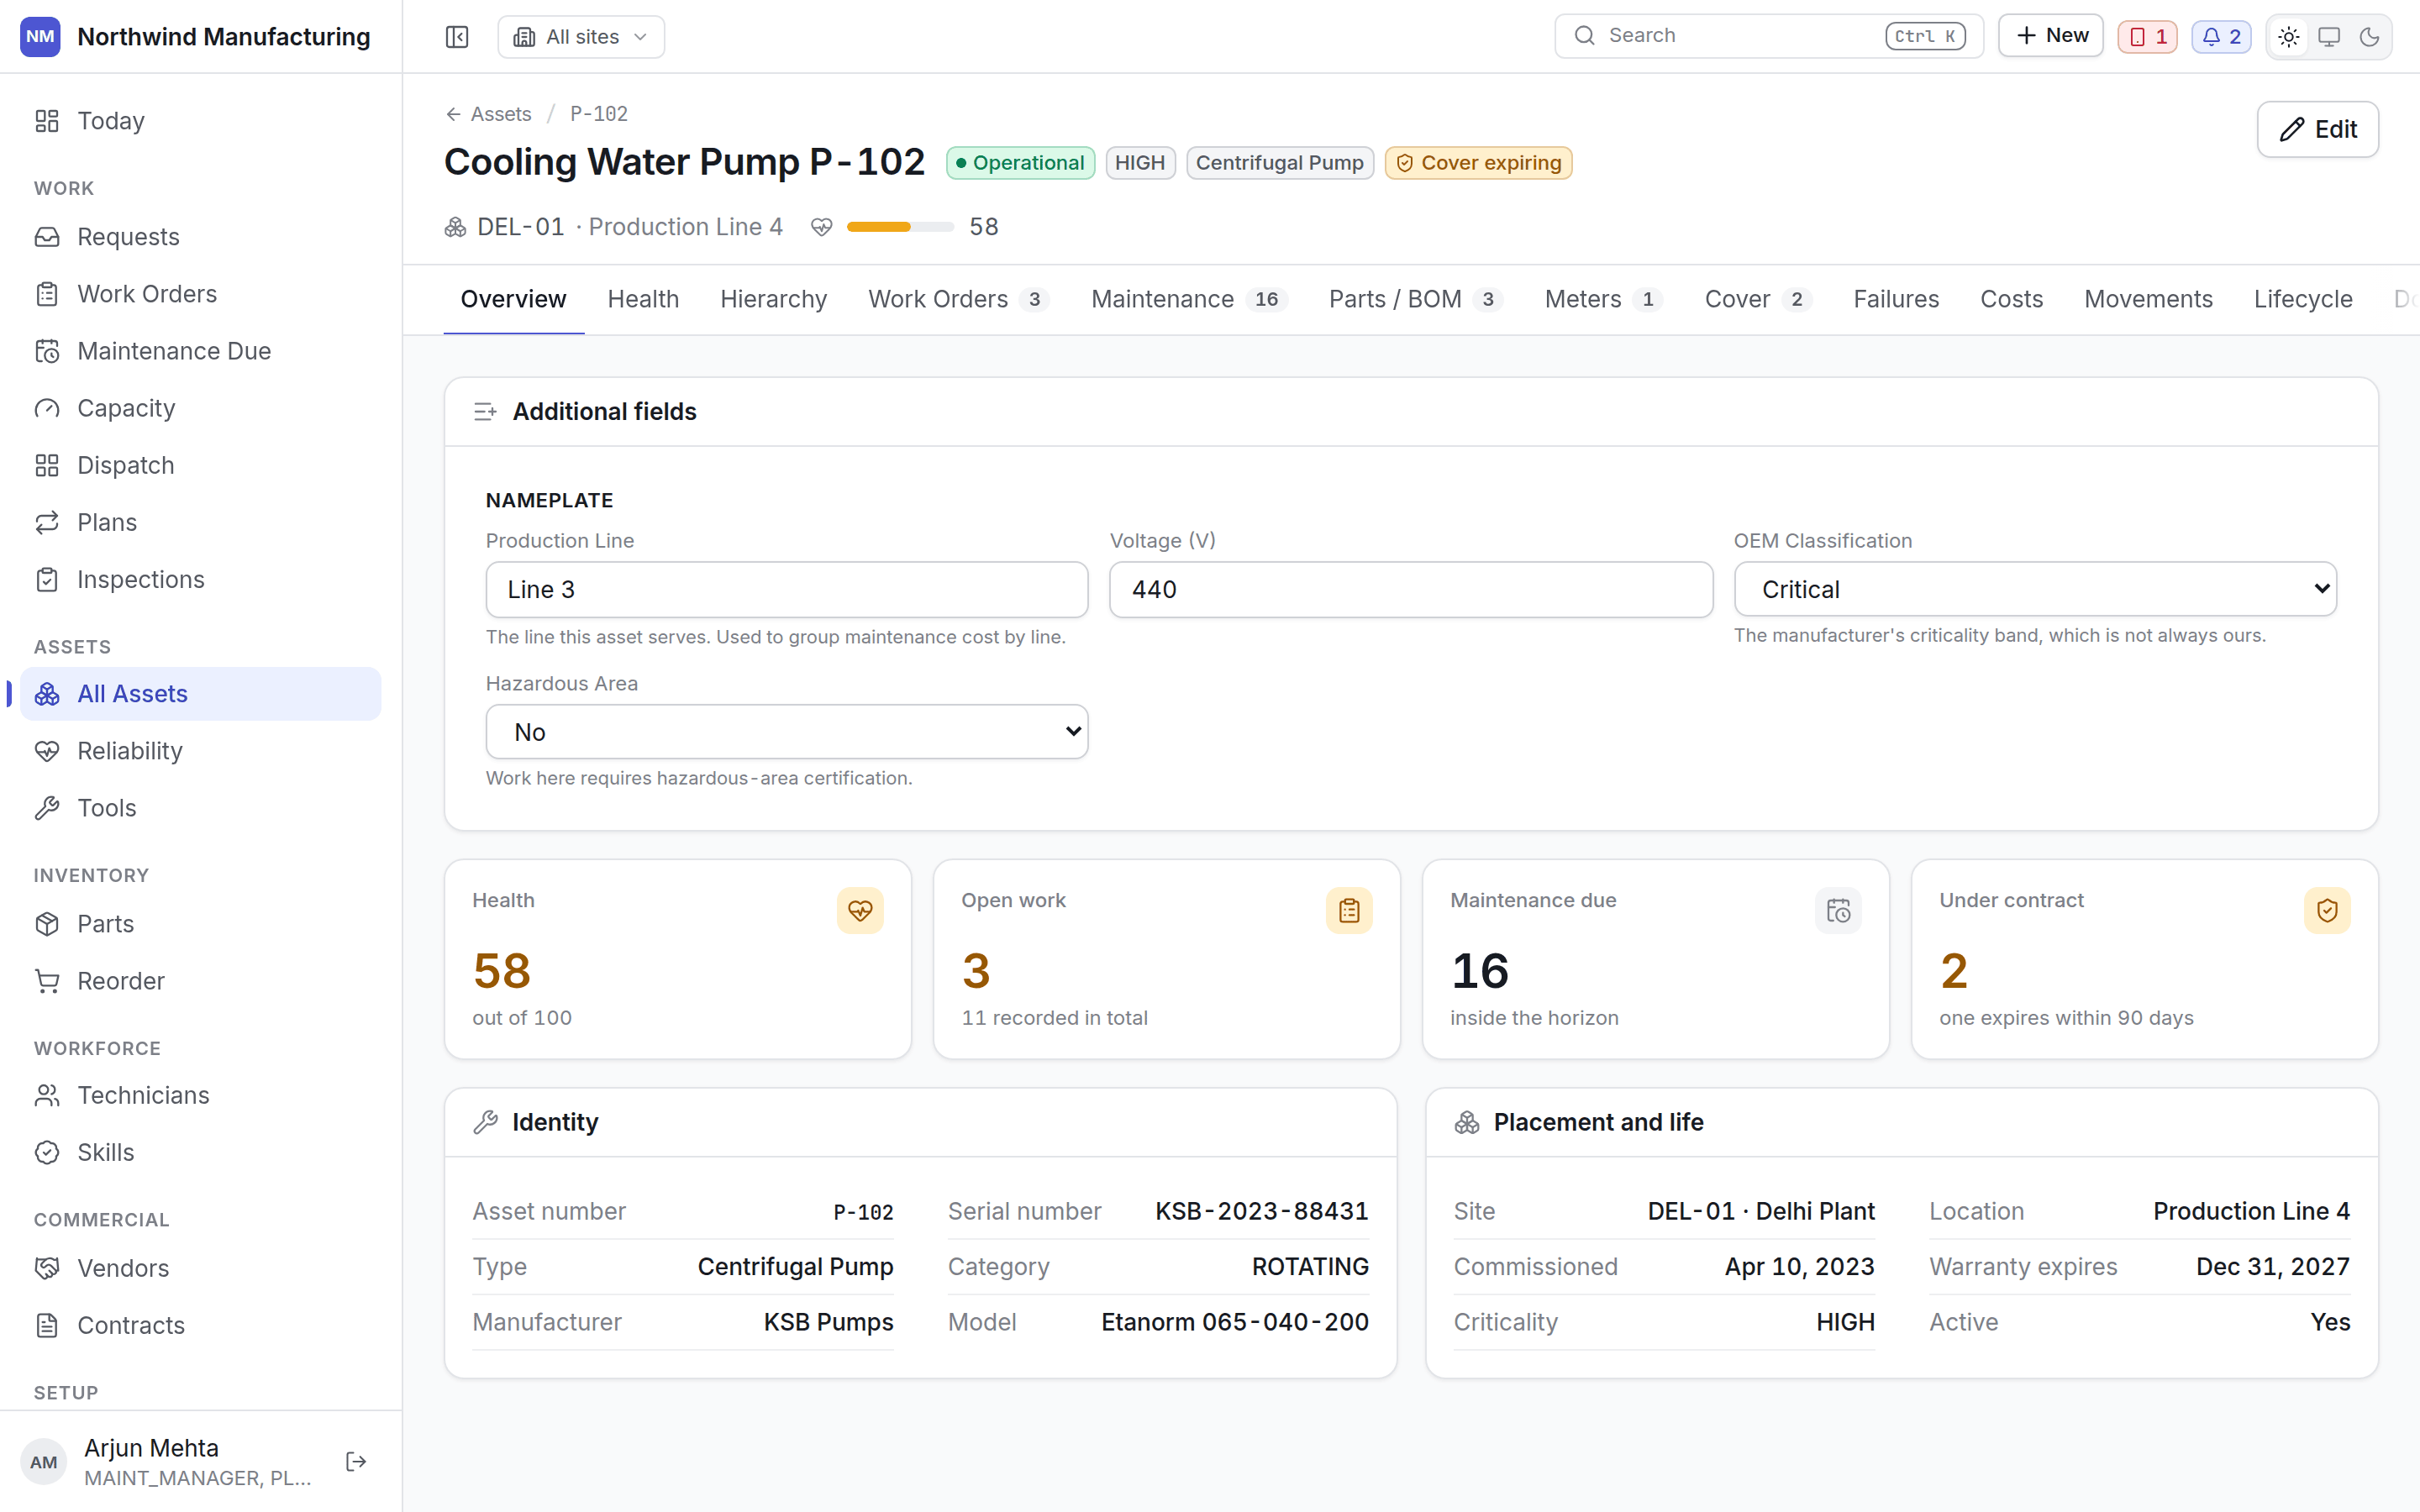
Overview
Overview
Identity and specification: number, name, type, category, criticality, manufacturer, model,
serial, location, parent, purchase cost and date, plus any custom fields your plant added.
Health
Health
The health score, and how it was arrived at.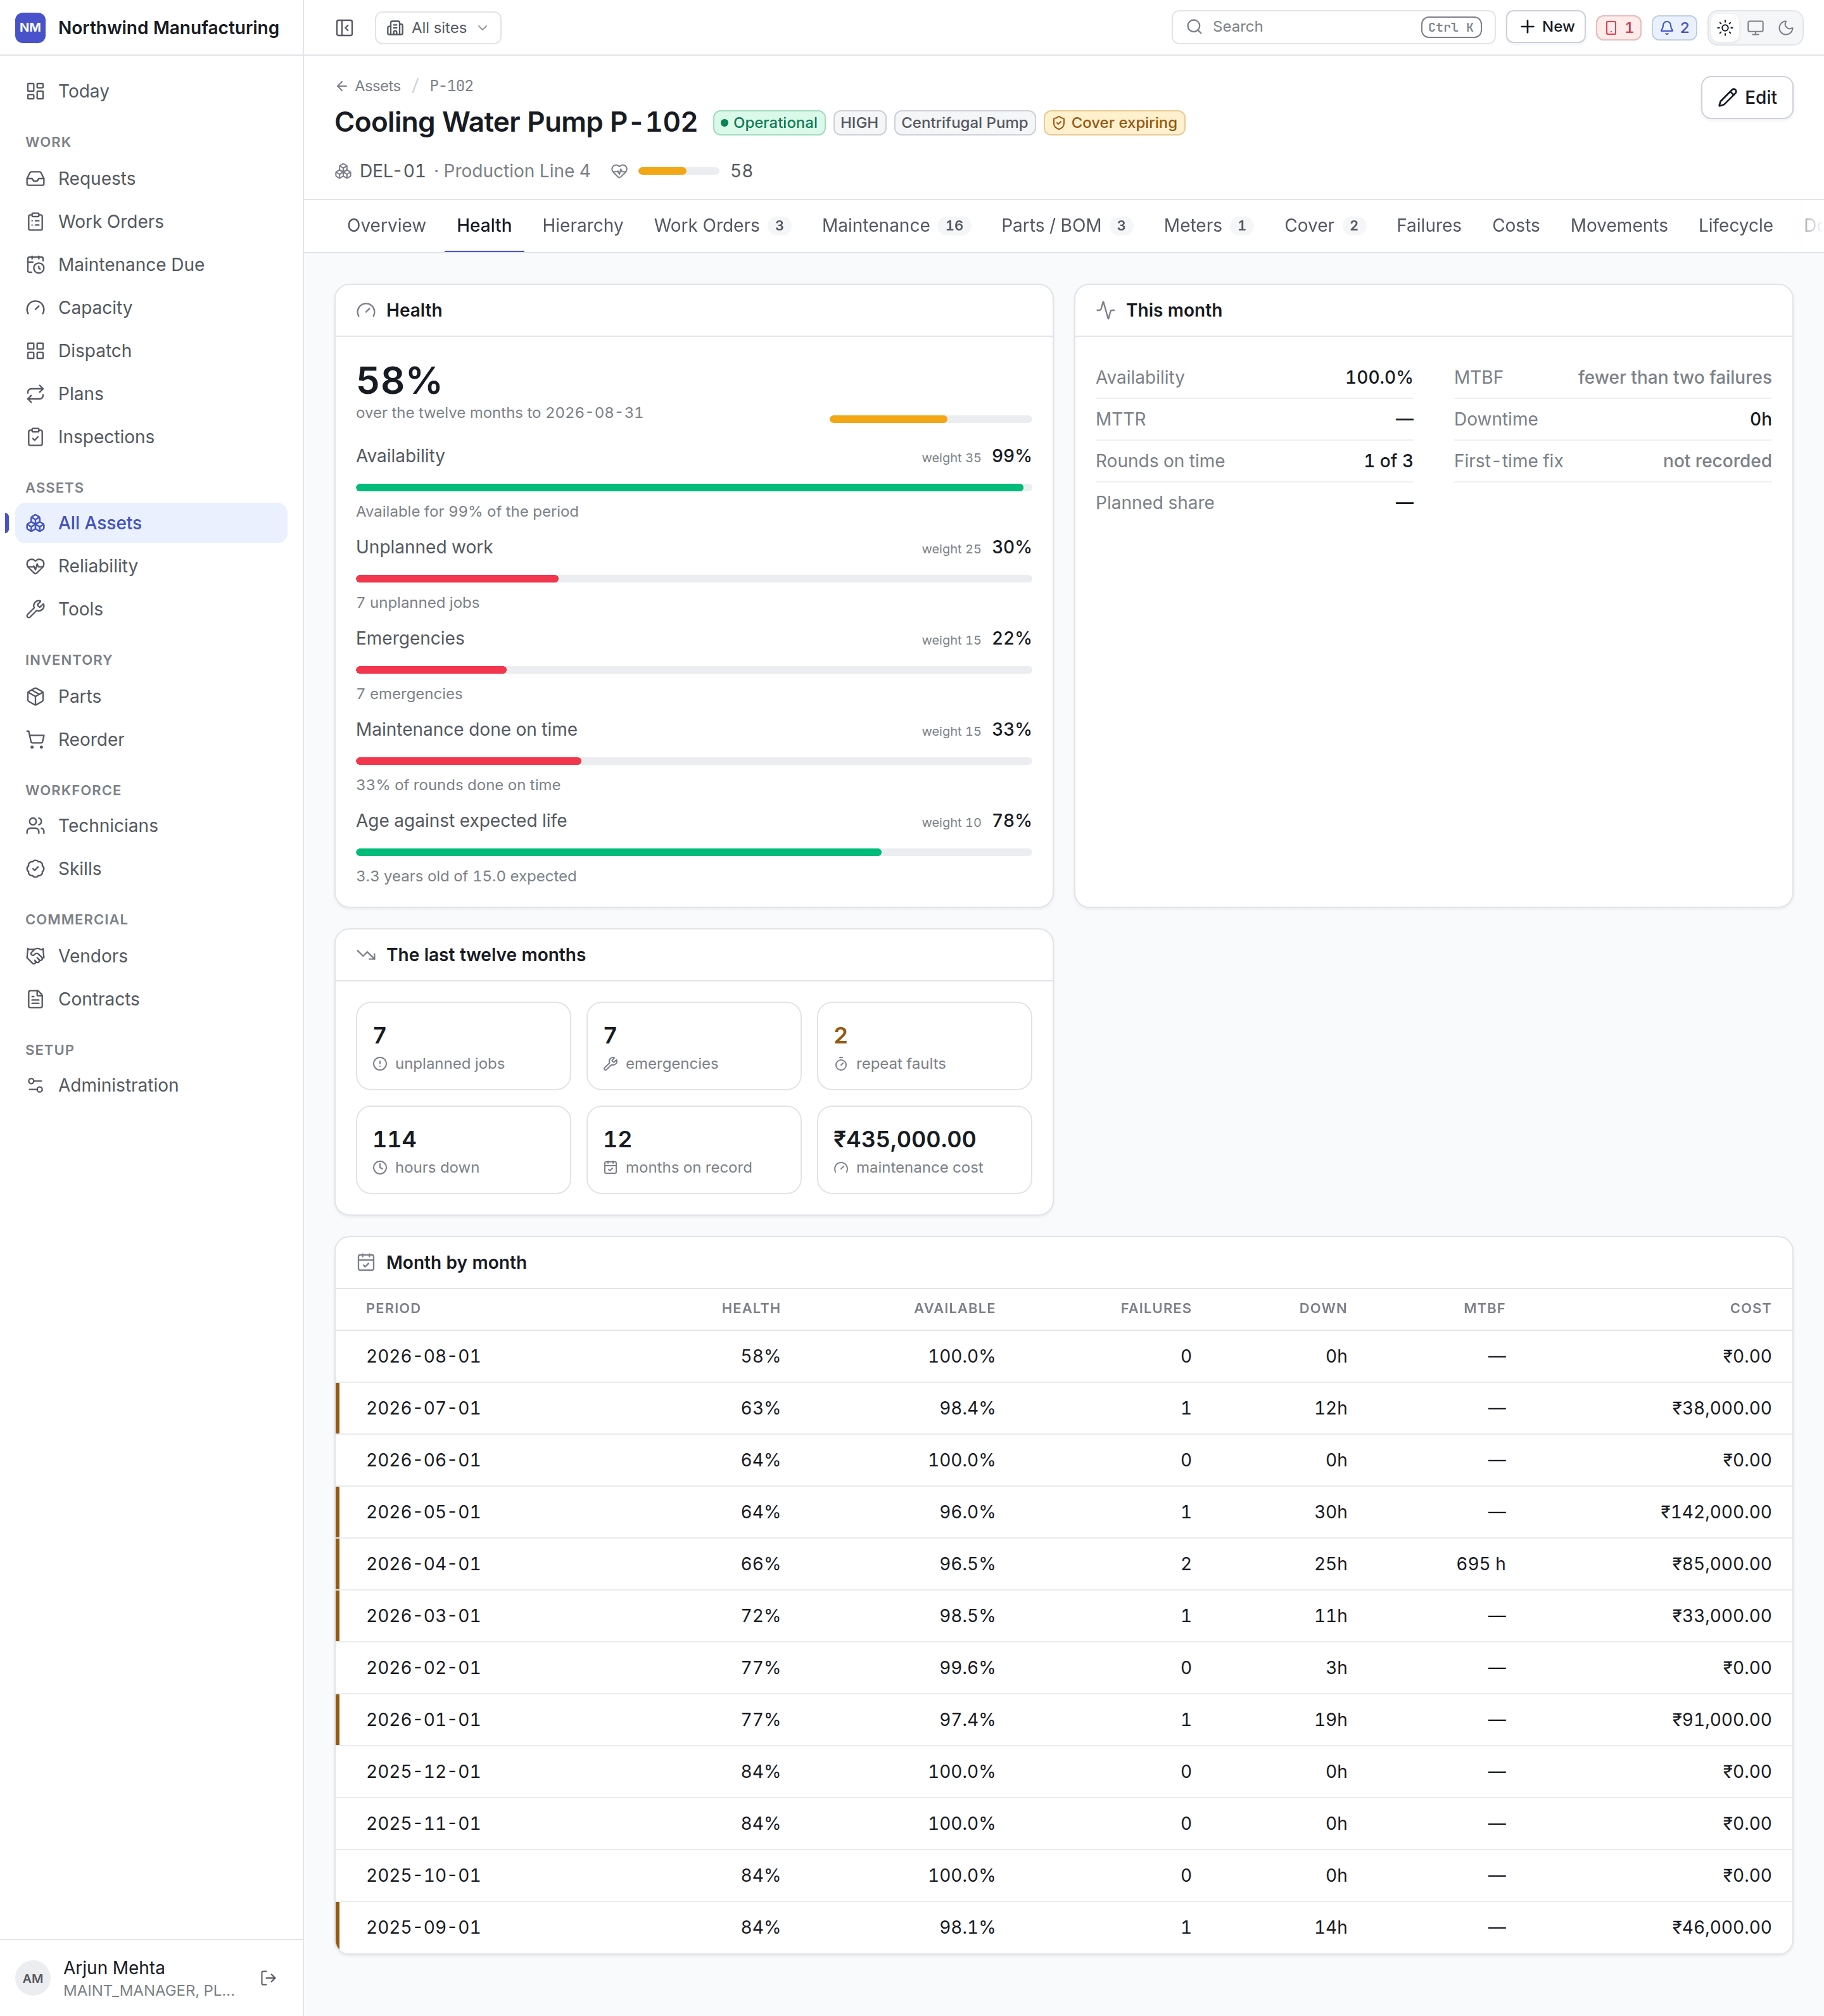
Hierarchy
Hierarchy
Where this asset sits — its parent, and everything below it. Work and cost roll up this tree.
Work orders
Work orders
Every job on this machine, open and historical, with a count on the tab. This is the machine’s
repair history and the thing to read before deciding whether a fault is new.
Maintenance
Maintenance
Which plans cover this asset and what is due next. Doing two rounds in one
release is usually cheaper than two shutdowns, and this is where you see the chance.
Parts / BOM
Parts / BOM
The bill of materials — which parts fit this machine. It is what makes “which filter does P-102
take” answerable at the store counter, and what lets planned maintenance forecast demand.
Meters
Meters
Run hours, cycles, production counts, temperatures.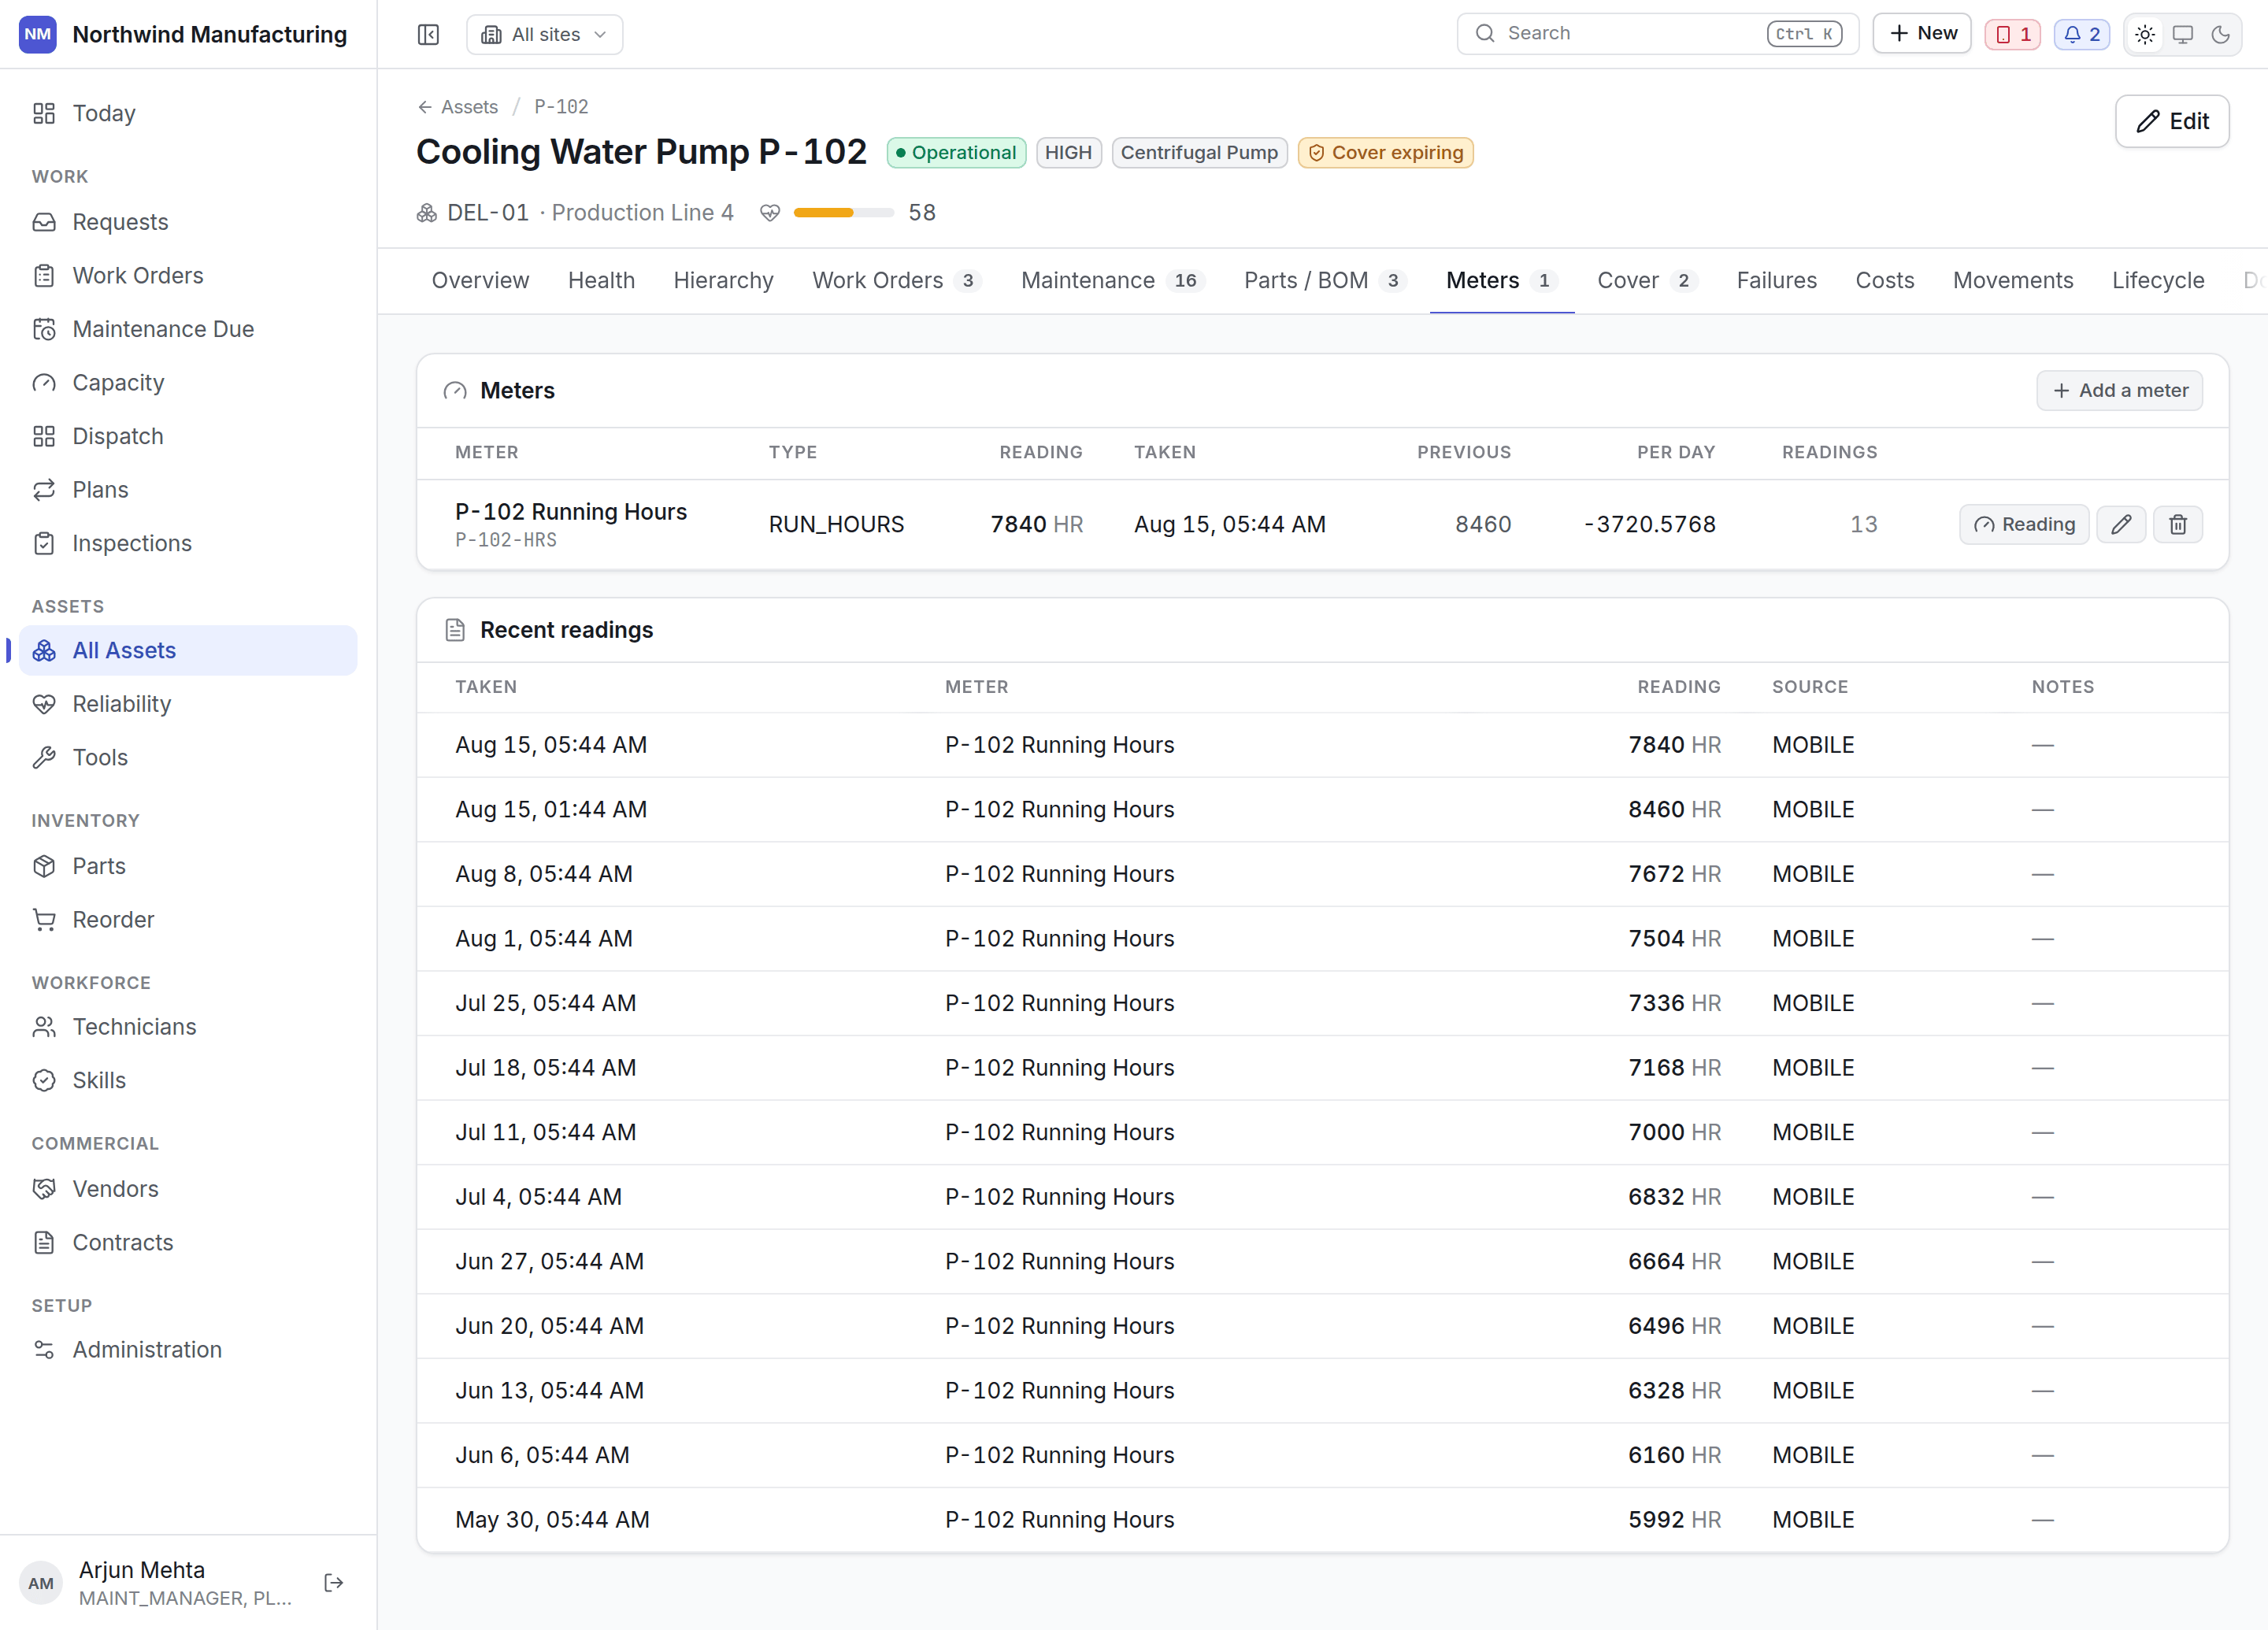
Cover
Cover
Who pays if this breaks: the contracts and warranties covering this machine, together.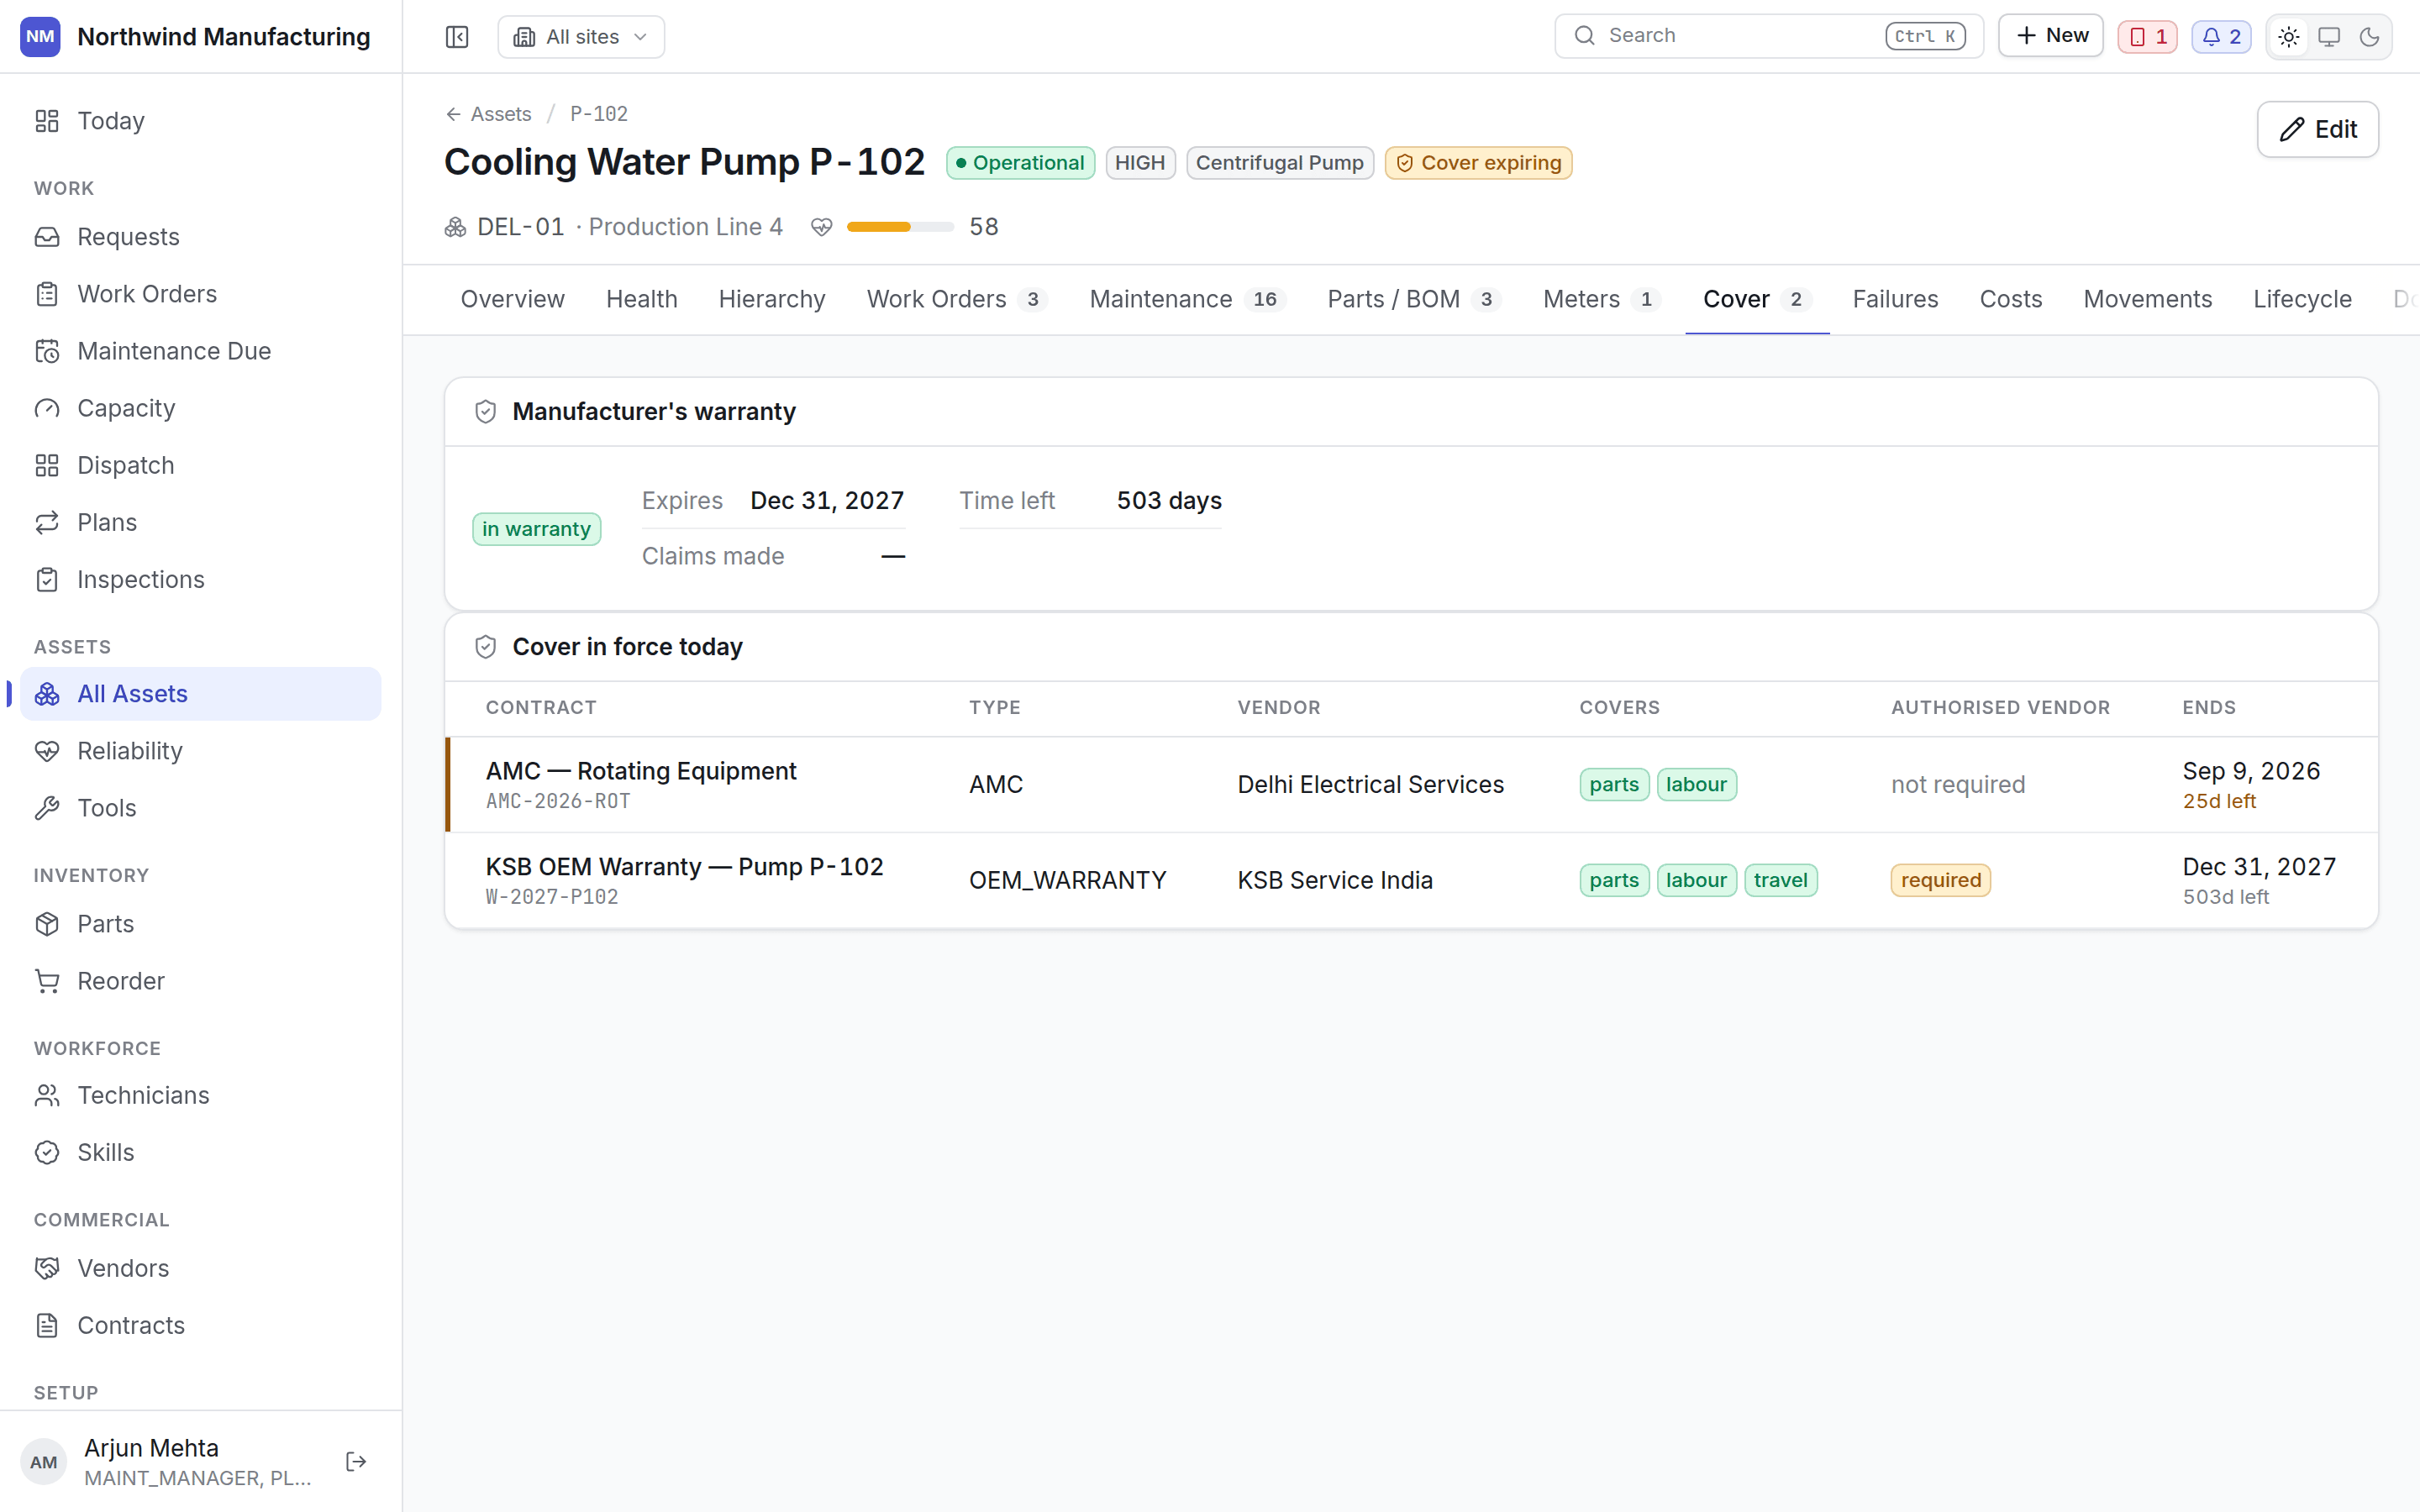
Failures
Failures
What has actually broken, with a count of what is still open. Failures drive MTBF, downtime and
the bad-actor ranking on Reliability.
Costs
Costs
What this machine has cost to maintain — labour, parts, tools, travel, vendor charges — over
time. Read against purchase cost, this is the replacement argument.
Movements
Movements
Where this asset has been. Transfers between locations and sites, with dates and who moved it.
Lifecycle
Lifecycle
Its state history — planned, received, commissioned, in service, down, retired, disposed — with
dates. See the asset lifecycle.
Downtime
Downtime
Time this machine spent in a state your model counts as down, and what it cost in availability.
Files
Files
Manuals, drawings, certificates, photographs. The tab carries the count.
Copilot
Copilot
Ask for a diagnosis or for help with this machine, using its own history and its recorded
failures. Suggestions are proposals — nothing reaches the record until somebody accepts one.The tab is here because the useful place to ask what is wrong with a pump is on the pump. It is
empty until your organisation has agreed to switch the copilot on. See
Copilot.
Activity
Activity
Every change to this record in order, plus comments.
Audit
Audit
Full field-level change history. Visible to roles carrying audit permission.